
 1 Registry Star
Part:BBa_J23119:Experience
This experience page is provided so that any user may enter their experience using this part.
Please enter
how you used this part and how it worked out.
Experience of the Nottingham 2018 iGEM team
Usage and Biology
BBa_J23119 is a constitutive promoter constructed by a previous iGEM team. We wanted to establish whether this promoter would be suitable for use in our non-model organism chassis Clostridium difficile, and also wanted to put the strength of this promoter into context by characterising fluorescence using the iGEM Interlab calibration curves, and also compare its strength to the Interlab positive and negative controls. The construct BBa_K2715119 allows us to characterise this promoter more extensively in E. coli with a standardised and reproducible measurement of fluorescence. Additionally this promoter was characterised in C. difficile using the gusA biobrick BBa_K330002 as a reporter gene in place of GFP, as GFP requires oxygen in order to function, and C. difficile is an anaerobic organism. The gusA containing composite used to assay the promoter activity in C. difficile is BBa_K2715027.
Characterisation
In these composite parts we've added a strong RBS BBa_K2715009, shown to function in Gram-positive and Gram-negative organisms, downstream of the BBa_J23119 promoter, driving expression of either GFP or GusA. The composites are part of a family of composite parts which were all characterised in the same plasmid backbone and in parallel in two fluorescence assays, the results of which can be seen below. The positive and negative controls are parts BBa_I20270 and BBa_R0040 respectively, used in the Interlab 2018 study. The composite parts tested in this assay under the same conditions using a range of alternative promoters are as follows:
GFP assay in E. coli
BBa_K2715106
BBa_K2715114
BBa_K2715119
BBa_K2715001
BBa_K2715002
BBa_K2715003
BBa_K2715004

GusA assay in C. difficile
The gusA containing composites tested in this assay under the same conditions using a range of alternative promoters are as follows:
BBa_K2715025
BBa_K2715026
BBa_K2715027
BBa_K2715028
BBa_K2715029
BBa_K2715030
BBa_K2715031

Conclusions
These two composite parts have enabled a more standardised characterisation of BBa_J23119 when used in conjugation with a strong RBS shown to function in both Gram-positive and Gram-negative organisms, and the strength of BBa_J23119 can now be quantified using the iGEM 2018 interlab units of fluorescence, relative to the Interlab control plasmids, which will hopefully give future iGEM teams a more comprehensive understanding of its strength. We have also shown that this promoter has extremely low levels of activity in the Gram-positive organism C. difficile, and its therefore unlikely to be useful for other future iGEM teams looking to express genes in non-model Gram-positive organisms such as clostridia.
Applications of BBa_J23119
Experience of the IIT_Madras iGEM 2010 team.
As submitted on 29th Oct 2010, 0350 IST (+0530 GMT)The iGEM 2010 IIT Madras team worked with J23119 as a reference in order to characterise a new pH inducible promoter that we have added to the registry this year. While analysing the results of the charactersation experiment we conducted we found that this promoter, in conjunction with an RBS (J23119 + B0034) has upregulated activity at low pH (4.5 - 5).
Experimental Design
The experiment we conducted involved the use of the construct J23119+B0034 in the plasmid pGL3Basic, which is a promoter-less plasmid that contains Firefly Luciferase as a reporter. The plasmid was transformed into DH5Alpha and cultured as a primary inoculum in Luria Bertani media. Once the inoculum reached an OD600 of 1.0 the culture was used to inoculate pH adjusted media of pH 4.5, 5, 5.5, 6 and 7, all in duplicates. We regularly measured OD600 for these 10 cultures until their OD600 reached 0.5, or reached saturation. We then took 3 independent samples of these cultures with vigorous shaking in-between consecutive samplings.Observations and Inferences
In this way we obtained a measure of the Luminescence of 30 samples in an arbitrary unit, RLU/s (Relative Luminescence units per sec). The data is as tabulated below.
Table 1 and 2: Data representing experiment done at various pH in duplicate and sampling done in triplicate. The Luminescence has been normalised using harvest-time OD600 readings of each culture.
The data was also plotted, as shown below.

Figure 1: Experimental data plotted for the duplicates showing high level of reproducibility in the data.
From these results we infer that it is highly possible for the constitutive promoter J23119 to be under the control of another stress factor based on pH. In this case it is possible that due to the high pH stress in the medium, the luciferase is over-expressed. It should also be noted that our pH inducible (in the range of 5 - 6.5) did not show this increased activity at low pH.
For more information on our contribution to the world of Synthetic Biology, check out our wiki.
References
- pGL3Basic vector backbone, as distributed by Promega. http://www.ncbi.nlm.nih.gov/nuccore/13195703, last accessed on 30th Oct 2010, 0350 IST (GMT +0530).
- DH5Alpha E.coli strain. http://ecoliwiki.net/colipedia/index.php/DH5_alpha, last accessed on 30th Oct 2010, 0350 IST (GMT +530).
Experience of CLSB-UK-2016 iGEM team with Part:BBa_K2078002
Experimental Design
This consensus promoter was assembled with the reporter protein, blue-purple chromoprotein AmilCP. The construct was carried on the pSB1C3 plasmid for expression and amplification in E-Coli. The plasmid also contained chloramphenicol acetyltransferase for resistance during plating (CmR).

Observations and Inferences
Our E.coli grew slower than other transformants and we were also unable to recover as much plasmid by miniprep. The use of this strong consensus promoter slows down expression times of the AmilCP Part:BBa_K592025 in E-Coli by around 24hours. This image shows a pellet from 5ml LB broth with transformed E.coli and confirms that the part is expressed, but the amount of pellet was much less than we would normally expect to get from 5ml.
The delay in E-Coli growth is also shown by this 24hour streak plate. The chromoprotein is only just becoming visible suggesting that such a strong consensus sequence slows down both the expression time of the part and growth time of E-Coli.
.
Thessaly 2019 Characterization
Thessaly 2019 sought to characterize the coding sequence of TEM-optimized β-lactamase (BBa_I757010) under the regulation of the constituve Anderson Family promoters BBa_J23100, BBa_J23105, BBa_J23106, BBa_J23119. β-lactamase is an enzyme that hydrolyses β-lactams (e.g. ampicillin) and is naturally found in prokaryotic cells. A colorimetric assay has been developed using nitrocefin as a substrate which after hydrolysis from β-lactamase changes the reaction color, from yellow (380nm) to red (490nm).
To achieve that, the coding sequence was assembled with each promoter, a universal RBS (BBa_B0034) and a double terminator(BBa_B0015). The parts were cloned in pSB1C3 and pSB1K3 and transformed into E. coli DH5a competent cells.
In the photo below you can see the results of the primer addition using overhang PCR:
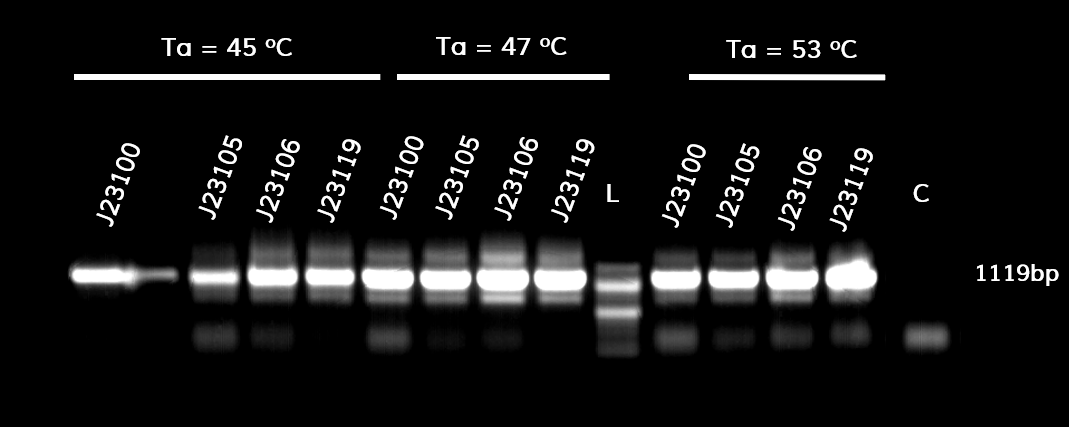
Figure 1. The results obtained after the PCR with the overhang primers for the different promoters of the Anderson family. We tested different annealing temperatures (45, 47 & 53℃) aiming for clear results. The expected band is at 1119bp and the ladder used was the 100bp DNA ladder by NEB.
For protein expression, the plasmids were transformed into E. coli BL21 (DE3) competent cells.
For the beta-lactamase assay, we set up the following experimental design:
1. Grow BL21 (DE3) pre-culture overnight in 5ml LB (~16h) at a shaking incubator, 37 degrees C / 210rpm
2. The following morning, measure the OD600 of overnight cultures
3. Dilute all cultures to OD600¬ = 0.05 in M9 minimal medium
4. Grow cells 37 degrees C /210 RPM until OD600=0.4-0.6 (~2h)
5. Dilute all cells to the same OD600 (e.g. 0.4)
6. Load 160 of culture in a 96-well plate (do triplicates). Add 40 ul 0.5 uM nitrocefin for a final concentration of 100nM
7. Measure the absorbance at 490nm (for nitrocefin hydrolysis) and 600nm (for cell growth) every 30 seconds for 2 hours in a microplate reader. Shake between readings. Because plateau was reached within the first 30 minutes of the reaction, only those are depicted in the graph.
To ensure that the absorbance shown corresponds only to enzymatic activity by β-lactamase, we included 3 controls in the experiment. The first control has M9 medium only (no cells) and nitrocefin, the second has empty BL21 (DE3) cells (no plasmid) and nitrocefin, while the third has BL21 (DE3) cells containing the plasmid but not the part (empty plasmid). To obtain comparable results, we normalized all values by dividing OD490 by OD600.
The results are shown in the graph below

Figure 2. The hydrolysis of nitrocefin enabled by the expression of the β-lactamase gene, under the control of different promoters (J23100, J23105, J23106 & J23119) of the Anderson family. The substrate (nitrocefin) hydrolysis (490nm) is divided by cell growth (600nm), in order to normalize all values.
The maximum expression of β-lactamase was observed under control of the J23119 (brown line) which is the wild type promoter of the Anderson family. The expression is reduced with the J23100 and J23106 (yellow and purple line respectively), while the lowest expression levels were observed with the J23105 promoter (blue line). These results are in accordance with those from previous teams that measured fluorescence and the same pattern is observed. The controls conditions (pSB1C3 and BL21, or light purple and light blue respectively) confirm that the absorbance measured derives from β-lactamase activity only, both quantitatively and visually.
Below you can see the 96-well plate of the assay:

Figure 3.The observed color change due to the hydrolyzation of nitrocefin due to the production of β-lactamase, after a 2-hour enzymatic assay.
Note that the picture was taken after the plate-reader assay was completed and all conditions had reached a plateau, except the controls.
User Reviews
UNIQf6fa3ed887c4a615-partinfo-0000000B-QINU
|
No review score entered. Sriram Srikant |
We used j23119 along with the RBS B0034 to provide a constitutive baseline expression during our characterization of p170 promoter cassette. To our suprise we found that under variable ph conditions the expression of the promoter varied, it showed extreme upregulation at low ph (~4.5). |
|
•••••
[http://2011.igem.org/Team:KULeuven K.U.Leuven iGEM 2011 Team] |
Characterization by K.U.Leuven 2011 iGEM Team We fused the constitutive promoter to a GFP reporter, and assayed the promoter’s activity after addition of different amounts of arabinose and IPTG. As such these results can serve as a control for the results obtained for the arabinose-inducible BBa_K584000 and IPTG-inducible BBa_K584002 bricks. We tested the activity in a TOP10F’ (Figure 1 & 3) as well as a MG1655 (Figure 2 & 4) E.coli strain background. For more information on E.coli strain descriptions, we recommend the following website: [http://openwetware.org/wiki/E._coli_genotypes E.Coli_Genotypes]. Apart from a small growth defect and a somewhat lower fluorescence at the 8 hour time point after the addition of 2% arabinose, the activity of the constitutive promoter in TOP10F’ cells is unaffected by arabinose addition, as seen in Figure 1. For the MG1655 cells (Figure 2), however, we see clear effects of adding arabinose at concentrations of 0.2% or 2%, with promoter activities significantly lower than the control condition. This points to interference of high inducer levels with the activity of the promoter and the importance of metabolism of the inducer, as arabinose can be metabolized by MG1655 cells, but not by TOP10F’ cells. For both TOP10F’ and MG1655 cells, the activity of the constitutive promoter is unaffected by the addition of IPTG (Figures 3 and 4).
Experience of NAU-CHINA-2016 iGEM team--Kejian ShiExperimental DesignTo evaluate each site of the Anderson Promoter`s effect on the whole promoter, the NAU-CHINA Team used TASSEL5 to analyse the correlation degree between each mutation and the strength of the promoter.We combine the sequence and the data of strength , the P-Value is calculated using the GLM whose result is showed as the Manhadon. Our purpose is to add information which can help users to mutate the promoter to the suitable one for their teams. Figure.1:It shows the correlation degree between the each position of the site of the promoter and the strength of the promoter using a series of Anderson promoters to analyse. The abscissa of the figure represents the position of the site of the sequence of the promoter. The position start at "0", so the last of the number of the site is "34". The ordinate of the figure represents the P-Value of the each site. The higher the P-Value is the higher effect of the site is,and the lower strength of the promoter is at the same time. For example ,we will find out that the 24th site reduce the strength of the promoter greatly from the figure. Figure.2:The left list shows the position of each site of the promoter,the right list contains the P-Value of the each site. Some of the sites do not have the mutation so that TASSEL can not calculate their P-Value. File:Strength data.xls File:Sequence data.xls The two attachments is the sequence data and the strength data used in analysing with TASSEL. |


